TANAGRAM ROADMAP: JUNE 2022
This is my fifth monthly public roadmap update for for Tanagram development (see previous updates here). I’m publishing this update to document my progress and hold myself accountable, and also provide a place to share some thoughts about what I plan to work on next.
Tanagram remains a nights-and-weekends project. My progress pace over the past month has been about 1 workday per week. I also spent an extended weekend with my family and didn’t get much done then.
Results: May 2022
I’ve spent the past month learning a bit of Figma and creating mock-ups of what I think Tanagram’s first-party UI could look like. I’d like Tanagram to primarily be a canvas on which users can add and arrange small panels of data as needed; Tanagram itself would have very little pre-built/hard-coded UI chrome.
Canvas User Journey: Building A Blog
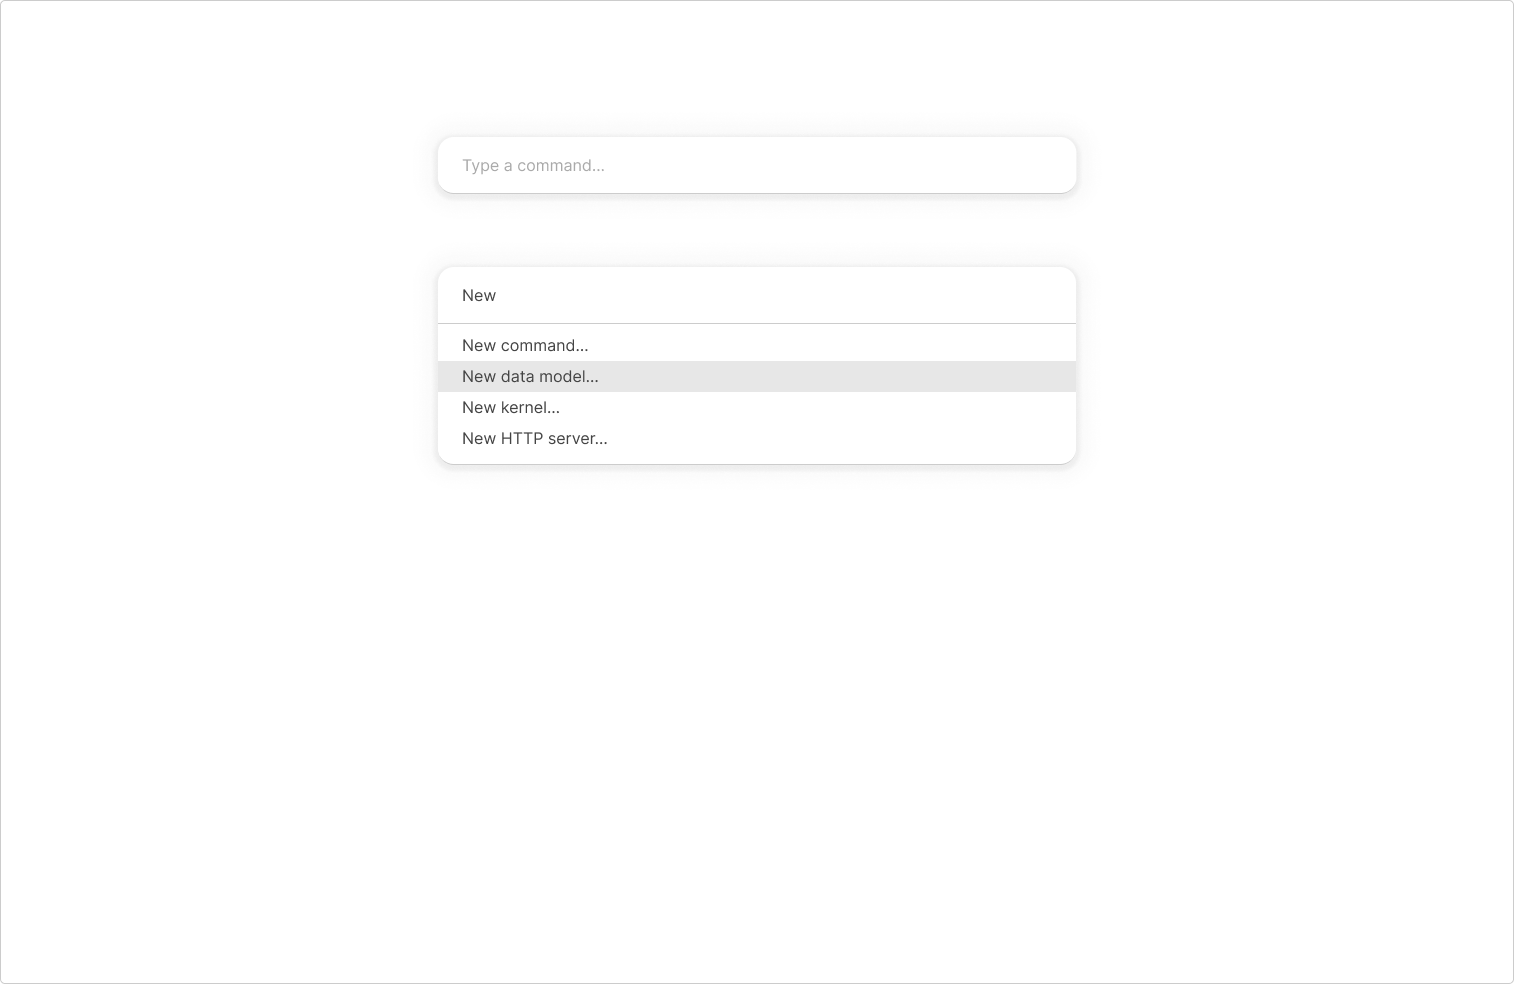
I started by drawing a hypothetical user journey of creating a simple blog from scratch — this is an alternative take on the user experience in demo 3. Starting from a blank canvas, the user brings up the command bar and creates a new data model. This sketch shows the command bar in its empty state as well as what it could look like after the user types “New” (it’s not meant to portray two command bars on-screen at the same time).
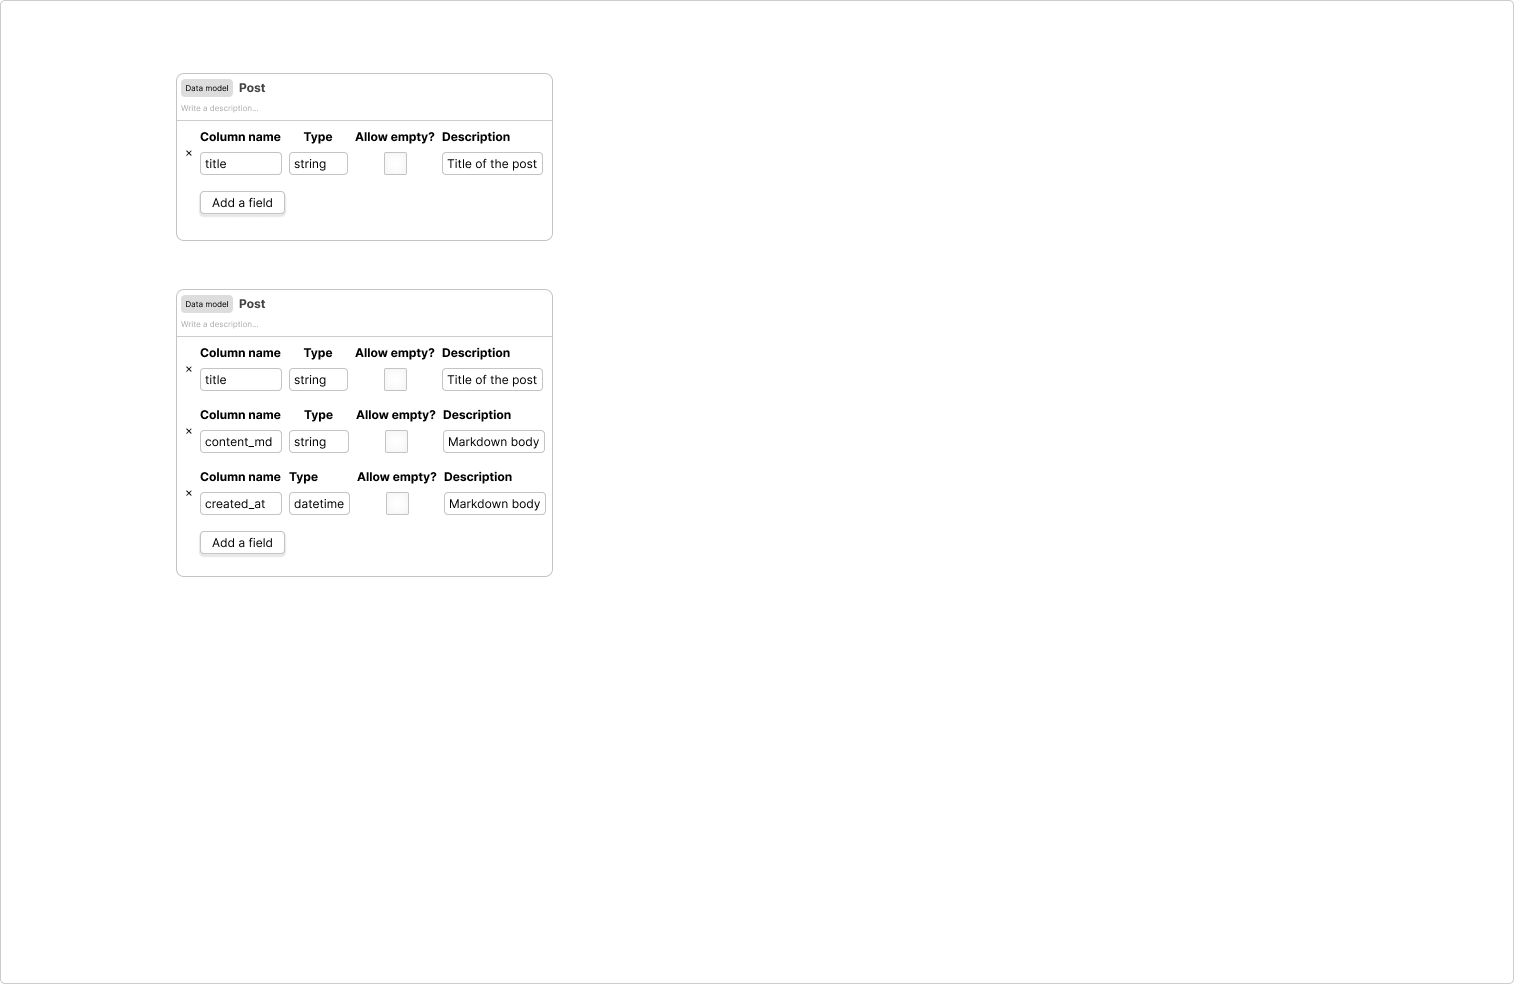
This brings up a pane representing this data model definition. In these mocks, panes have a few common elements:
- in the top-left, they have a tag indicating the type of item it is. This tag is also a proxy icon, allowing users to drag a reference to this item to somewhere else (I have an example of this below).
- Next to the tag is the name of the item. This is an editable text field, letting the user rename the item. Every item is Tanagram is backed by a stable ID, so changing the name doesn’t break anything.
- Below the name and tag is a description field. Every item in Tanagram can have a description, and by surfacing this field prominently, I’m hoping it’ll increase the likelihood that users add descriptions/documentation for items.
The user creates some fields representing their data model in the pane. As with the above sketch, the two panes here represent a before-and-after state of the pane, not two panes appearing simultaneously on-screen.
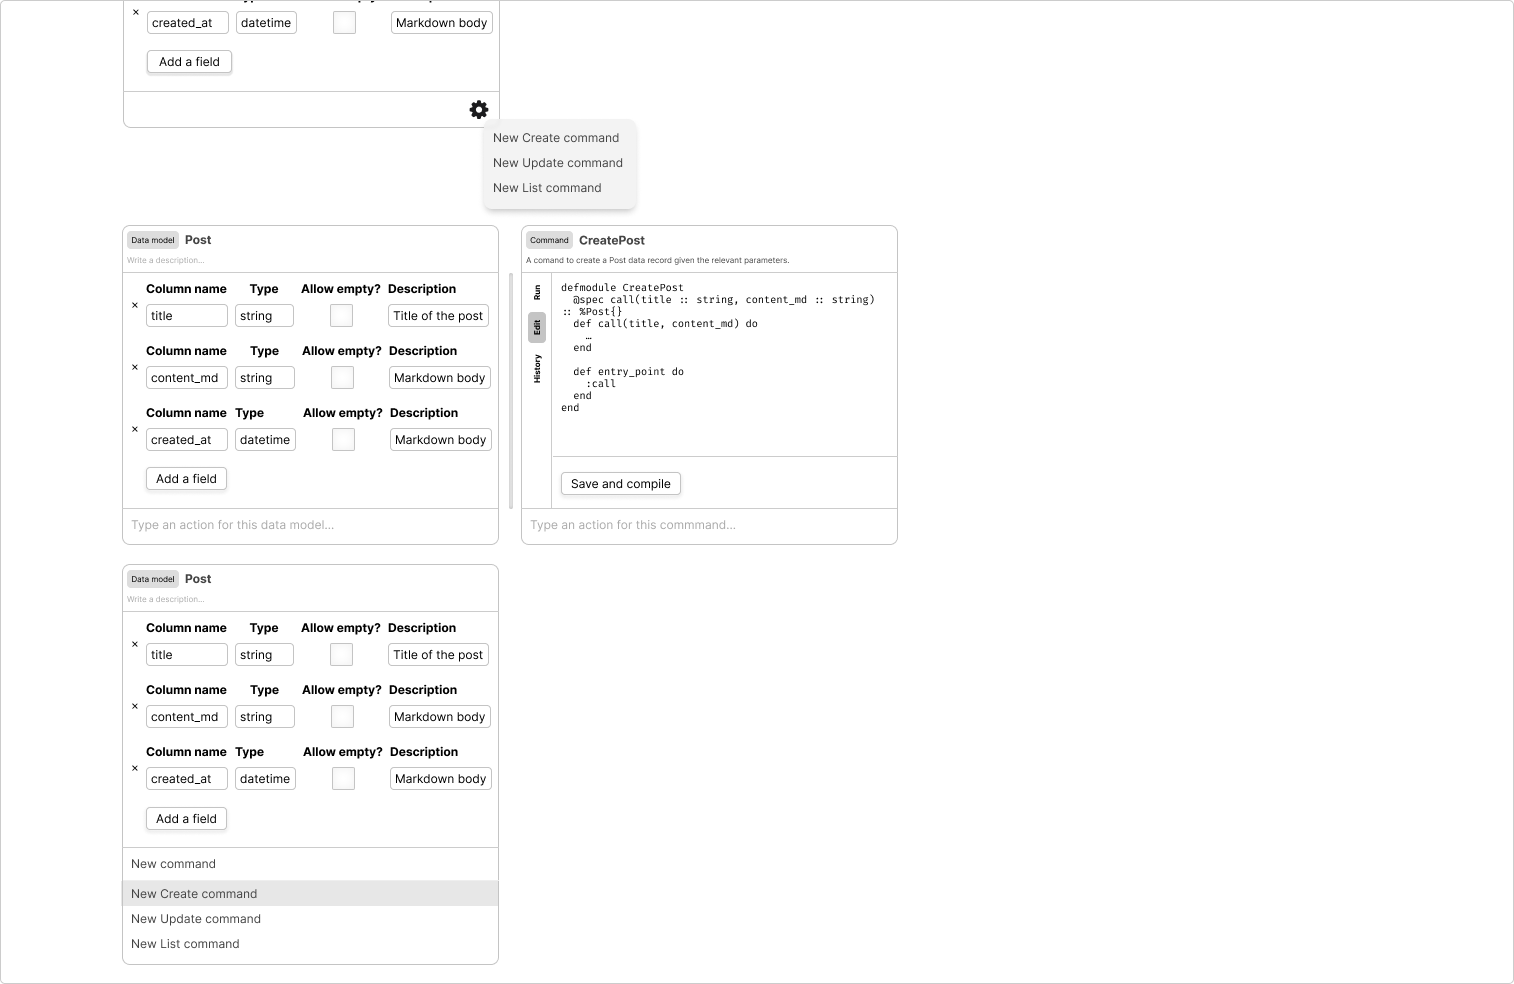
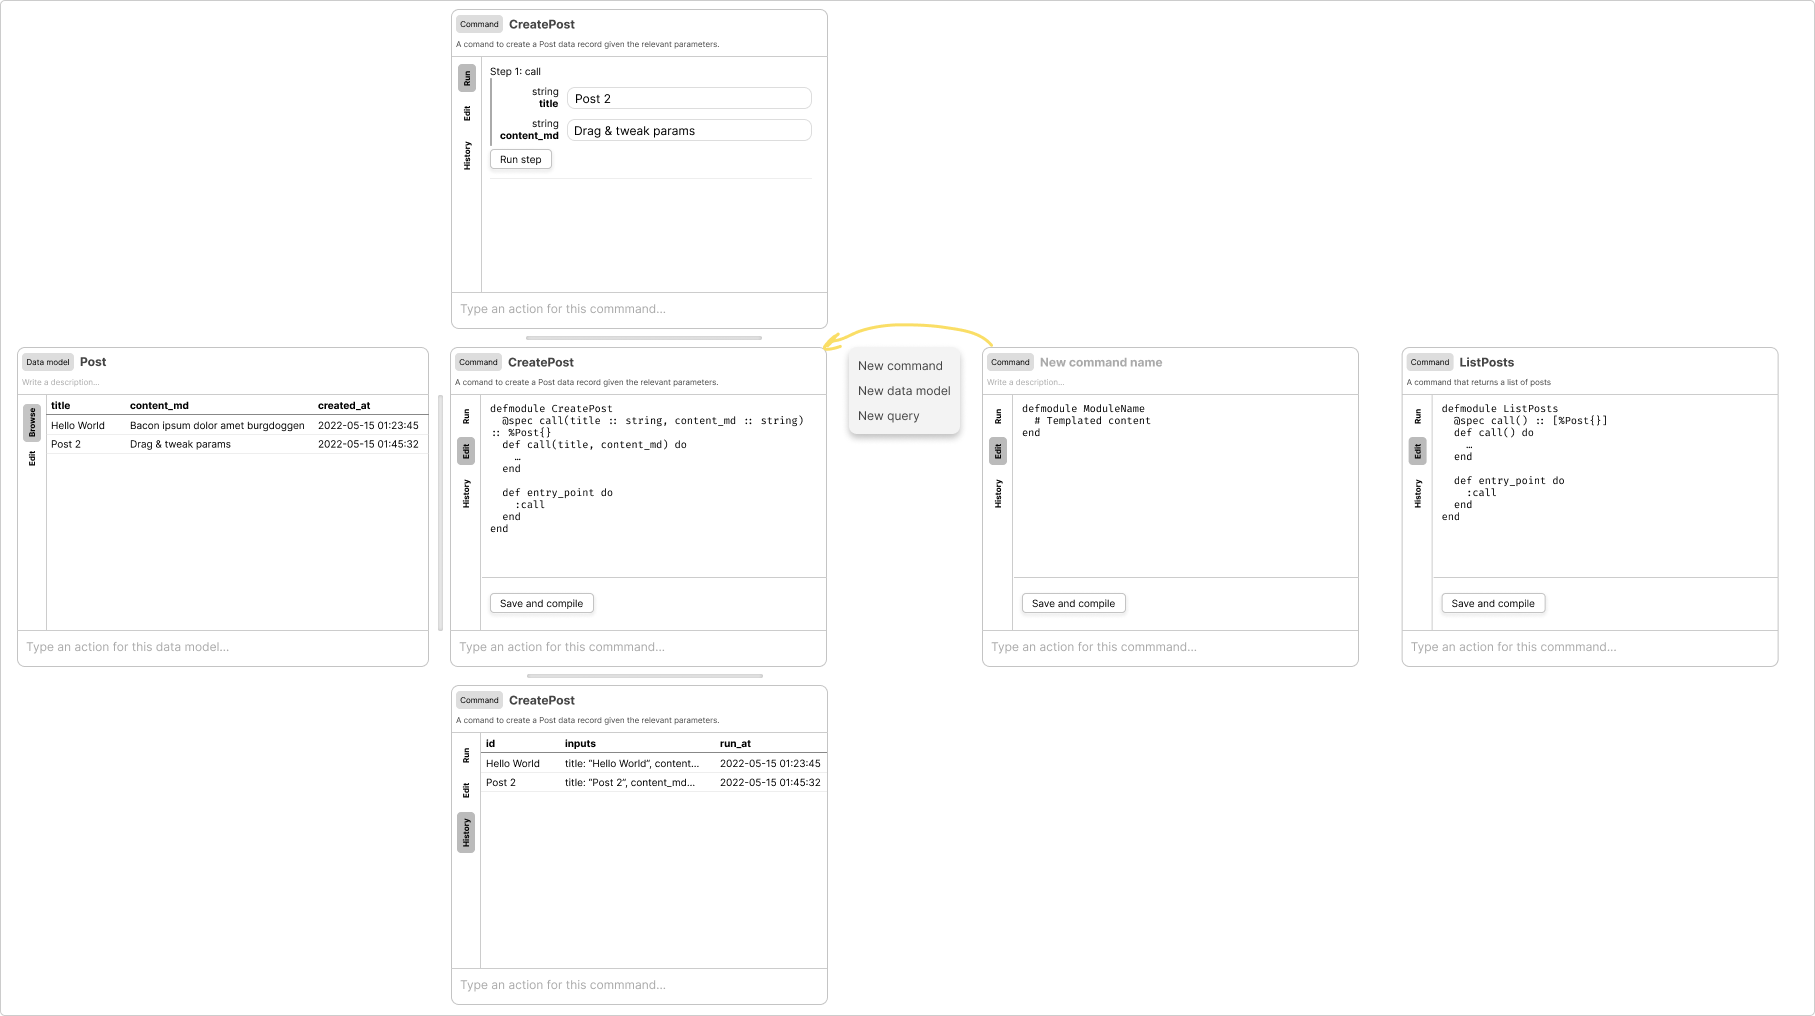
After defining a few fields for a Post data structure, the user wants to create a command that’ll create posts. I sketched two versions of this: in the top-left, the data model pane has an action button that brings up a menu of things the user could do with this data model. In the middle-left and bottom-left panes, I have an alternative where every pane has its own command bar, and the user types “New command” to get a list of such actions available to the data model. In either case, the result is the command pane in the middle-right. The newly-created command shows up in a new spot on the screen; it doesn’t replace the data structure pane on-screen. In addition, because the user created a “Create command” from a data structure, Tanagram can use the existing data model schema to generate a command with the corresponding inputs.
I’ve evolved the chrome for an item pane here:
- I’ve decided to go with a command bar on each item rather than an action button. This approach seems more keyboard-friendly, although I don’t feel strongly about it.
- On the left of each pane, there’s a strip of different view options for each item pane. For the
Postdata model pane (far left in the sketch below), there’s a “Browse” view, consisting of a table ofPostdata records, and an “Edit” view, shown above. For theCreatePostcommand pane (second column), there’s a “Run” view, showing the interface for running a command, an “Edit” view, showing the interface for editing the implementation of a command, and a “History” view, showing the history of invocations for the command. In previous prototypes, the History view looked like this.
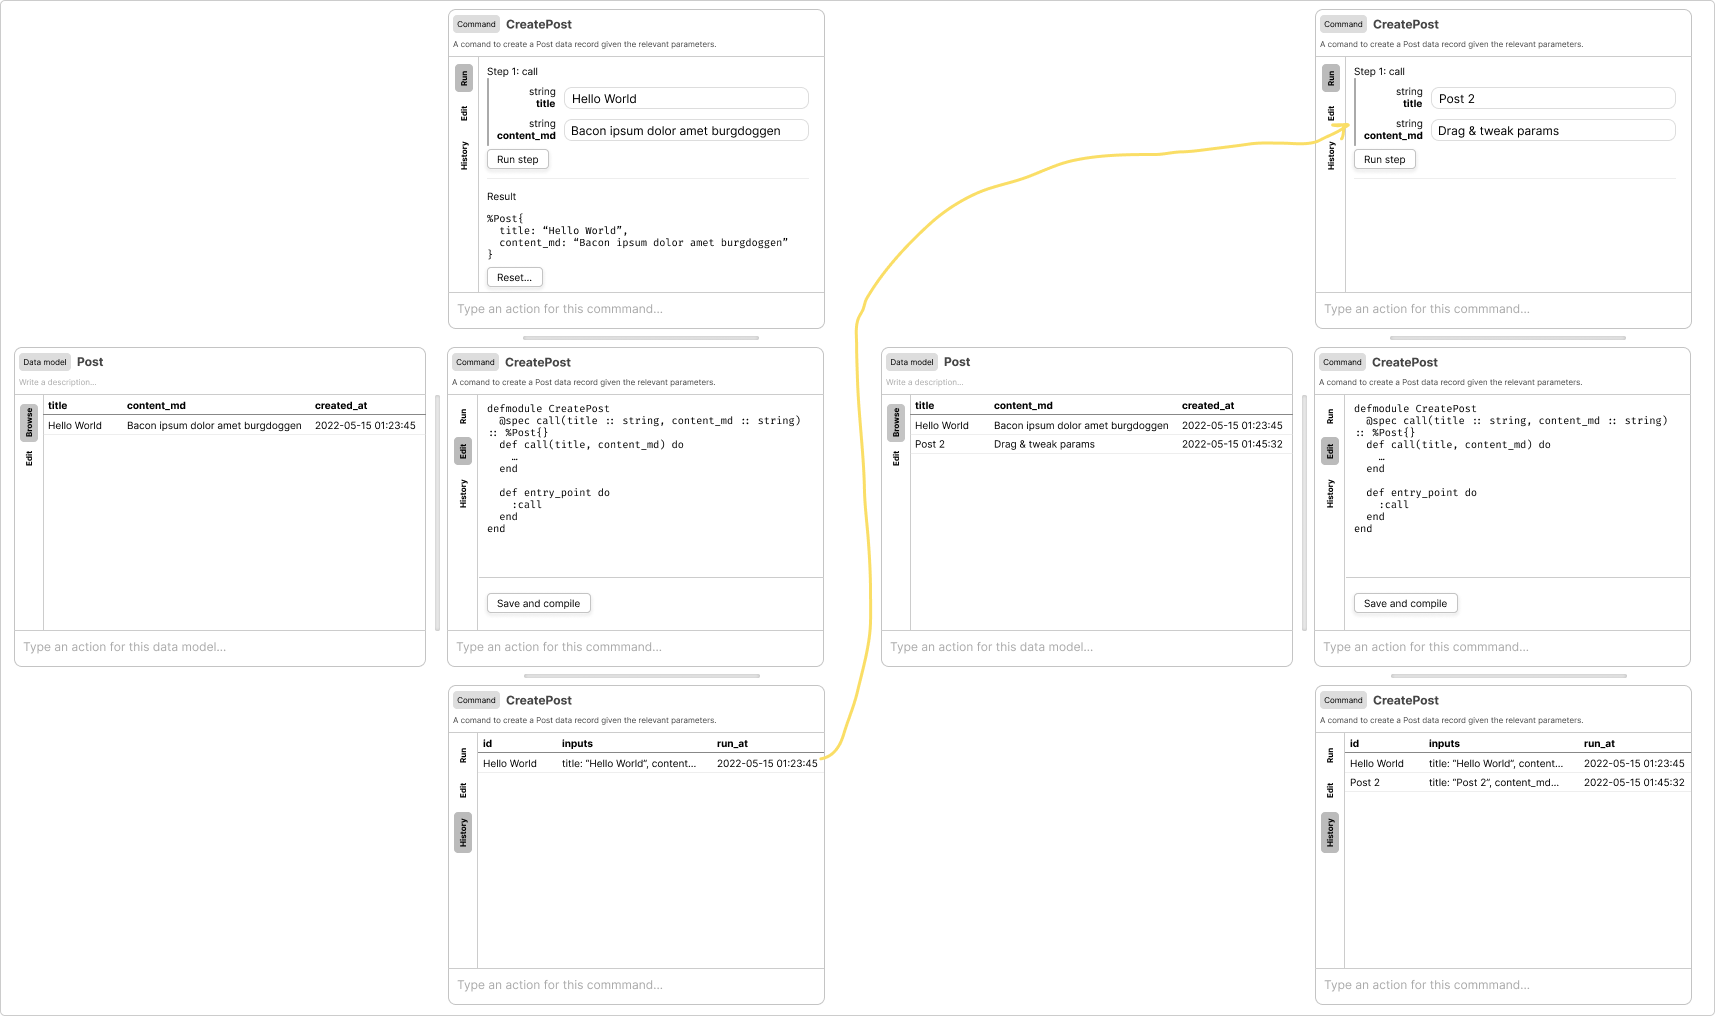
As mentioned earlier, Tanagram automatically populated the implementation of the CreatePost command with code based on the schema of the Post data model. The user can run this command out-of-the-box, passing in some default input (far-right column below). The Post data model pane, set to the “Browse” view, automatically shows this new data record.
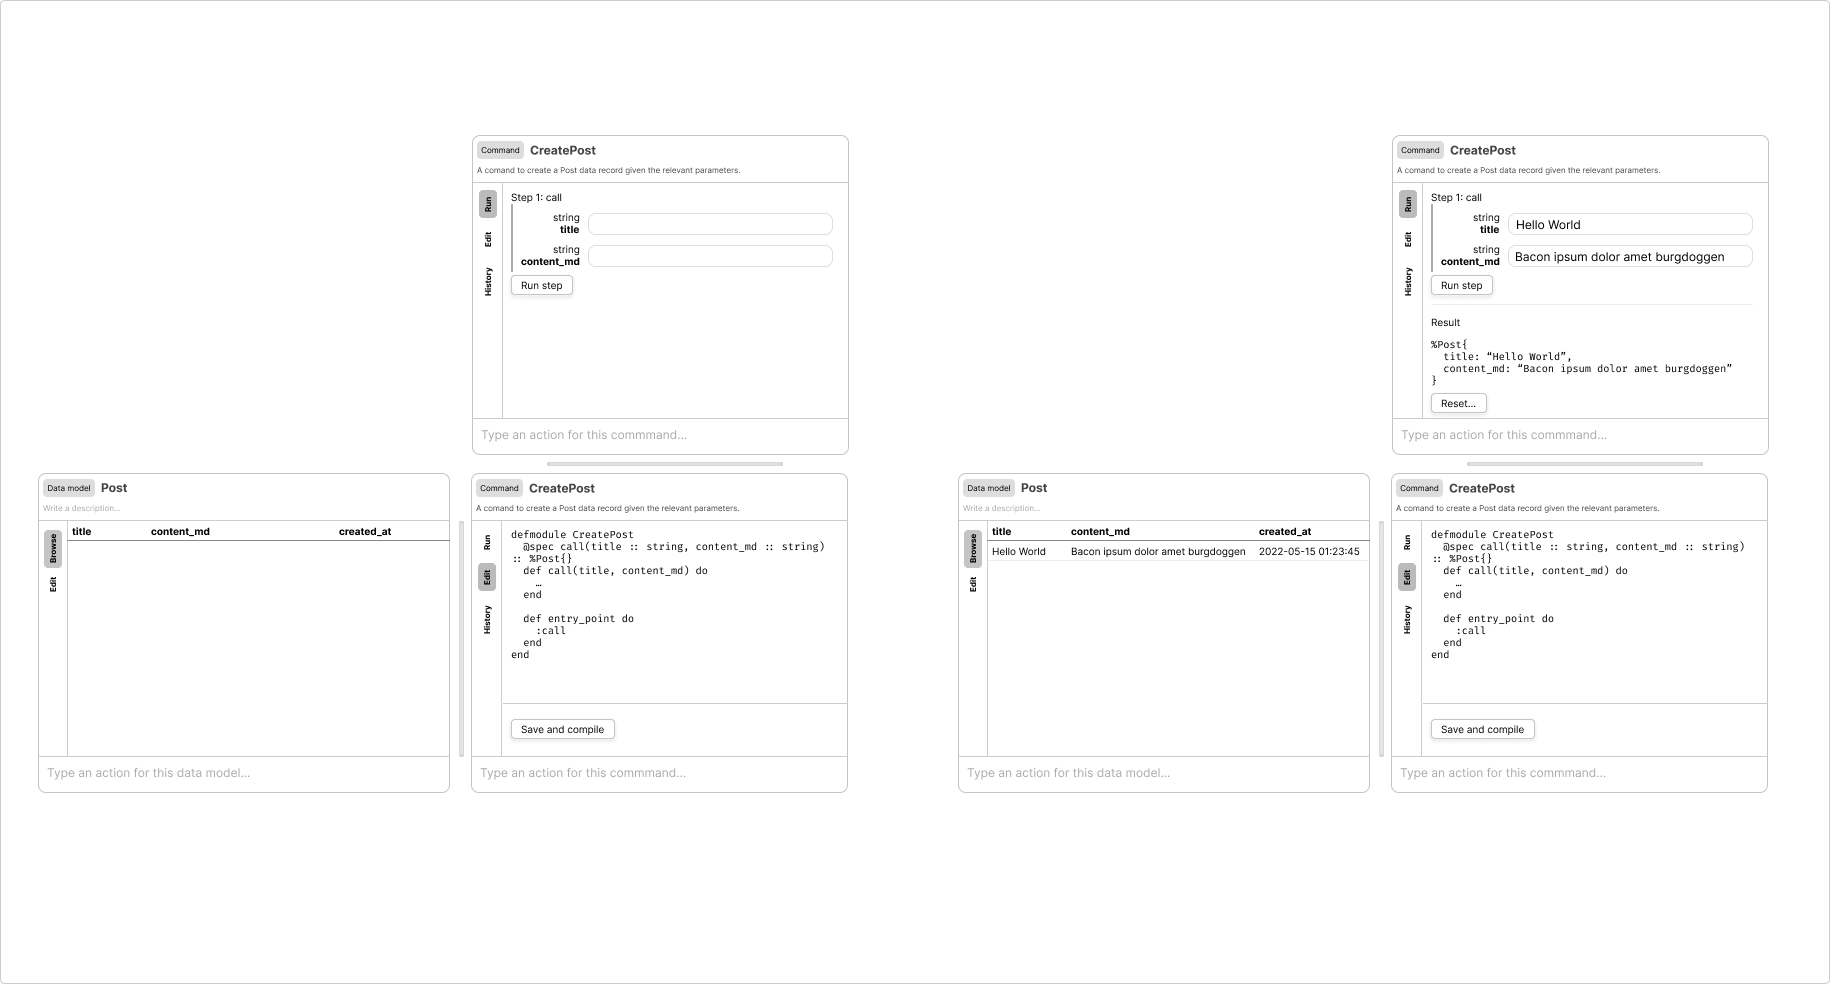
The user runs the command again to get more data into their database. In the sketch below, the second column now contains the “History” view of the CreatePost command (these views can each appear on-screen at the same time). The user can drag the previous invocation record into the “Run” view to pre-populate the “Run” view with the inputs from that invocation (that’s what the yellow arrow is indicating). Upon running the command again, the newly-inserted data record appears in the data model pane’s “Browse” view, and the new invocation appears in the command pane’s “History” view.
Next, the user creates a command to list posts. They right-click on an empty spot on the canvas to bring up a context menu, and select “New command”. An empty command pane appears; the user fills in its name, description, and implementation (right-most pane in the sketch below). Then — here’s a new, experimental concept I have in mind — the user control-drags the new pane to a previous pane (indicated by the yellow arrow) to link them together into a singular sequence. More on sequences below.
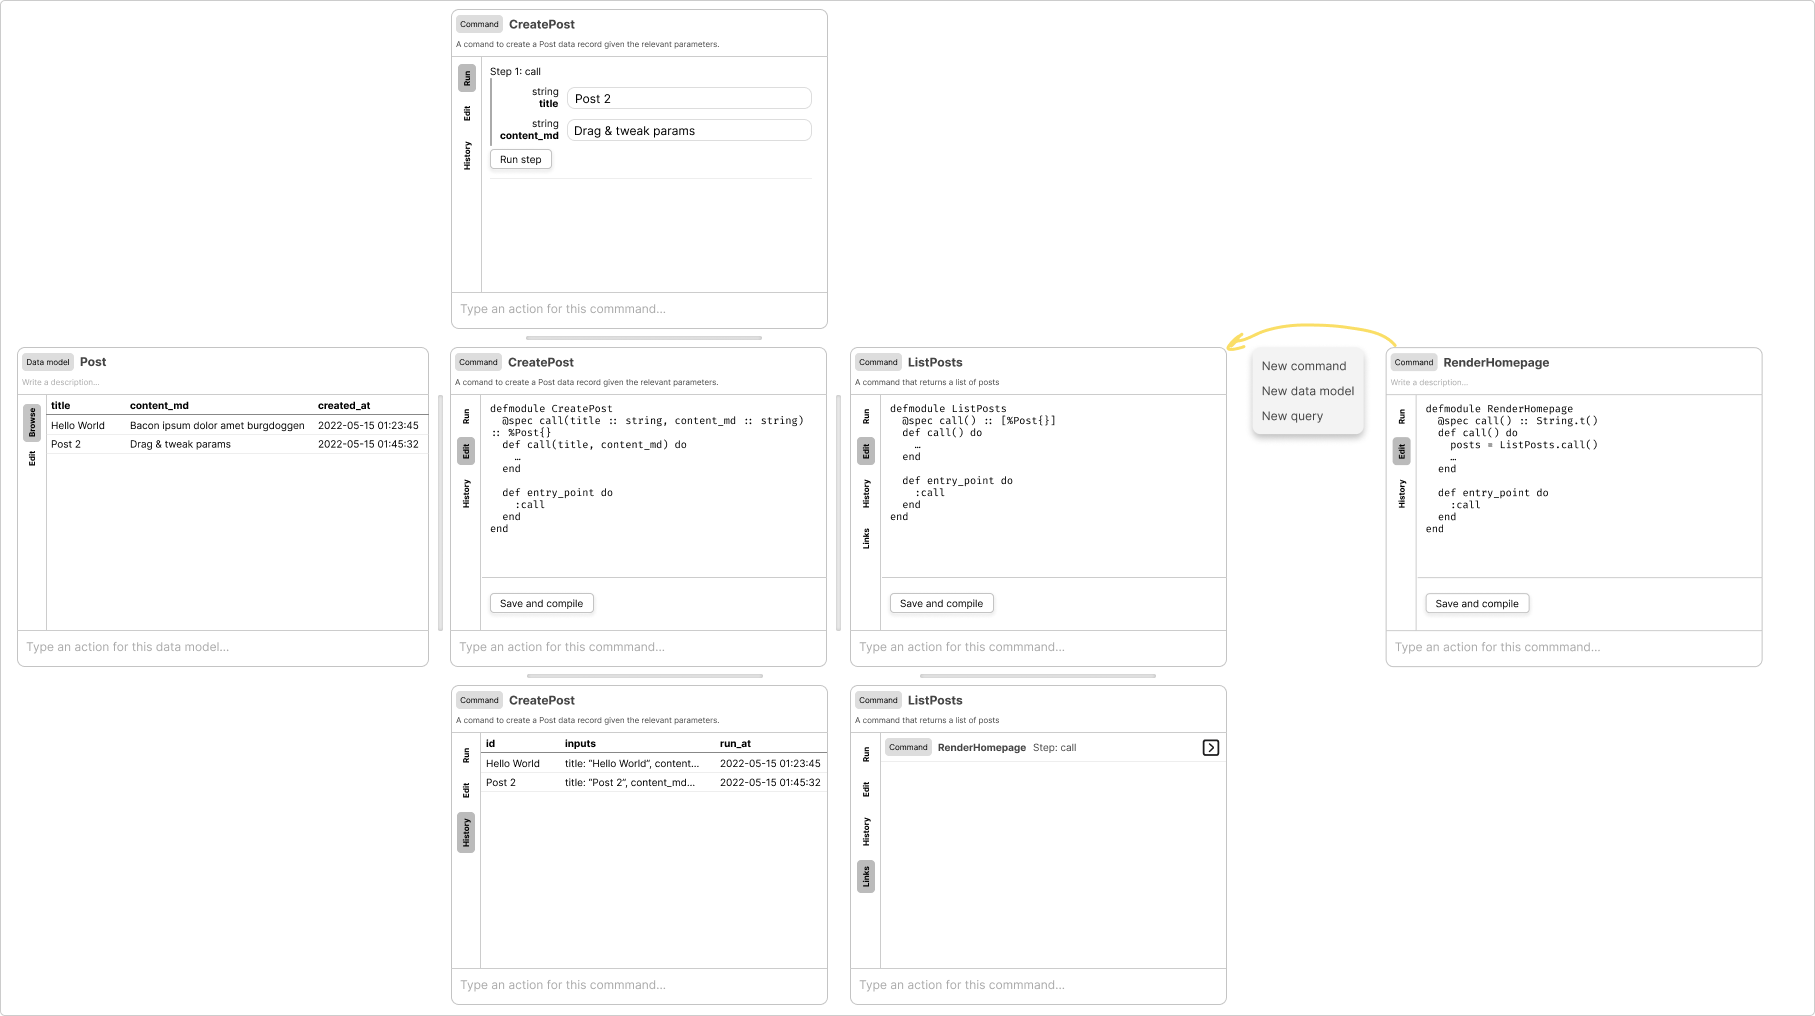
Similarly, the user creates a new command to render the homepage for their blog. They right-click, create a new command, fill out its implementation, and link it to the previous sequence. In the third column in the sketch below, I introduce a new view: “Links”. Items in Tanagram can form bi-directional links with others; in this case, the RenderHomepage command calls the ListPosts command, and that forms an automatic link between them. From the ListPosts command pane, the user could click through to a pane for the RenderHomepage command.
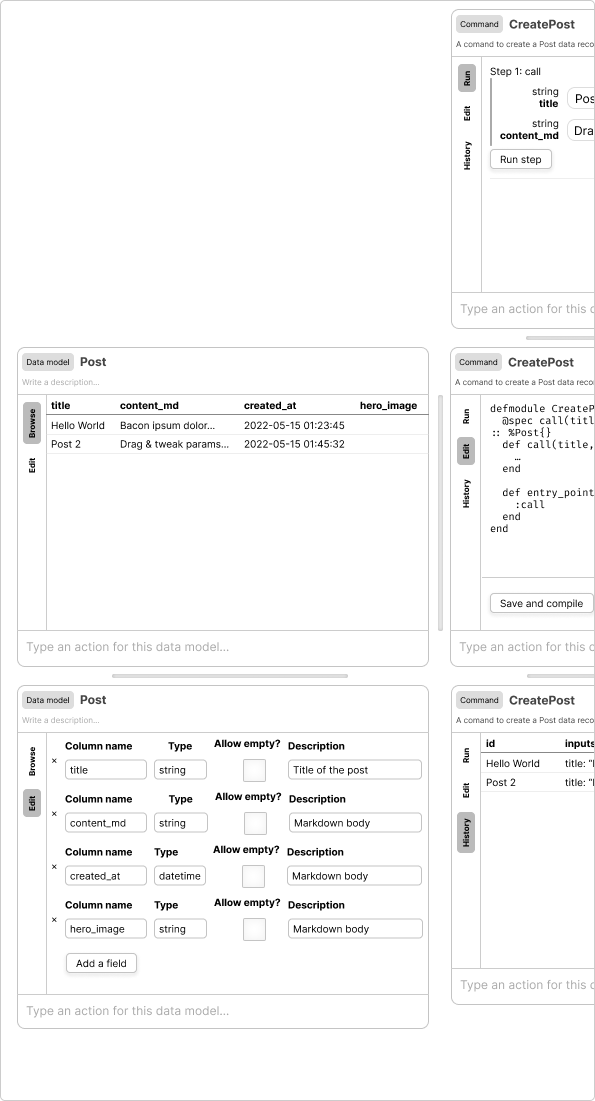
The user wants to add a new field to their Post data model, so they go to the existing Post pane and open the “Edit” view below it (bottom-left in the sketch below). From here, they add a new field (hero_image in this example). This new field is automatically reflected in the “Browse” view’s table.
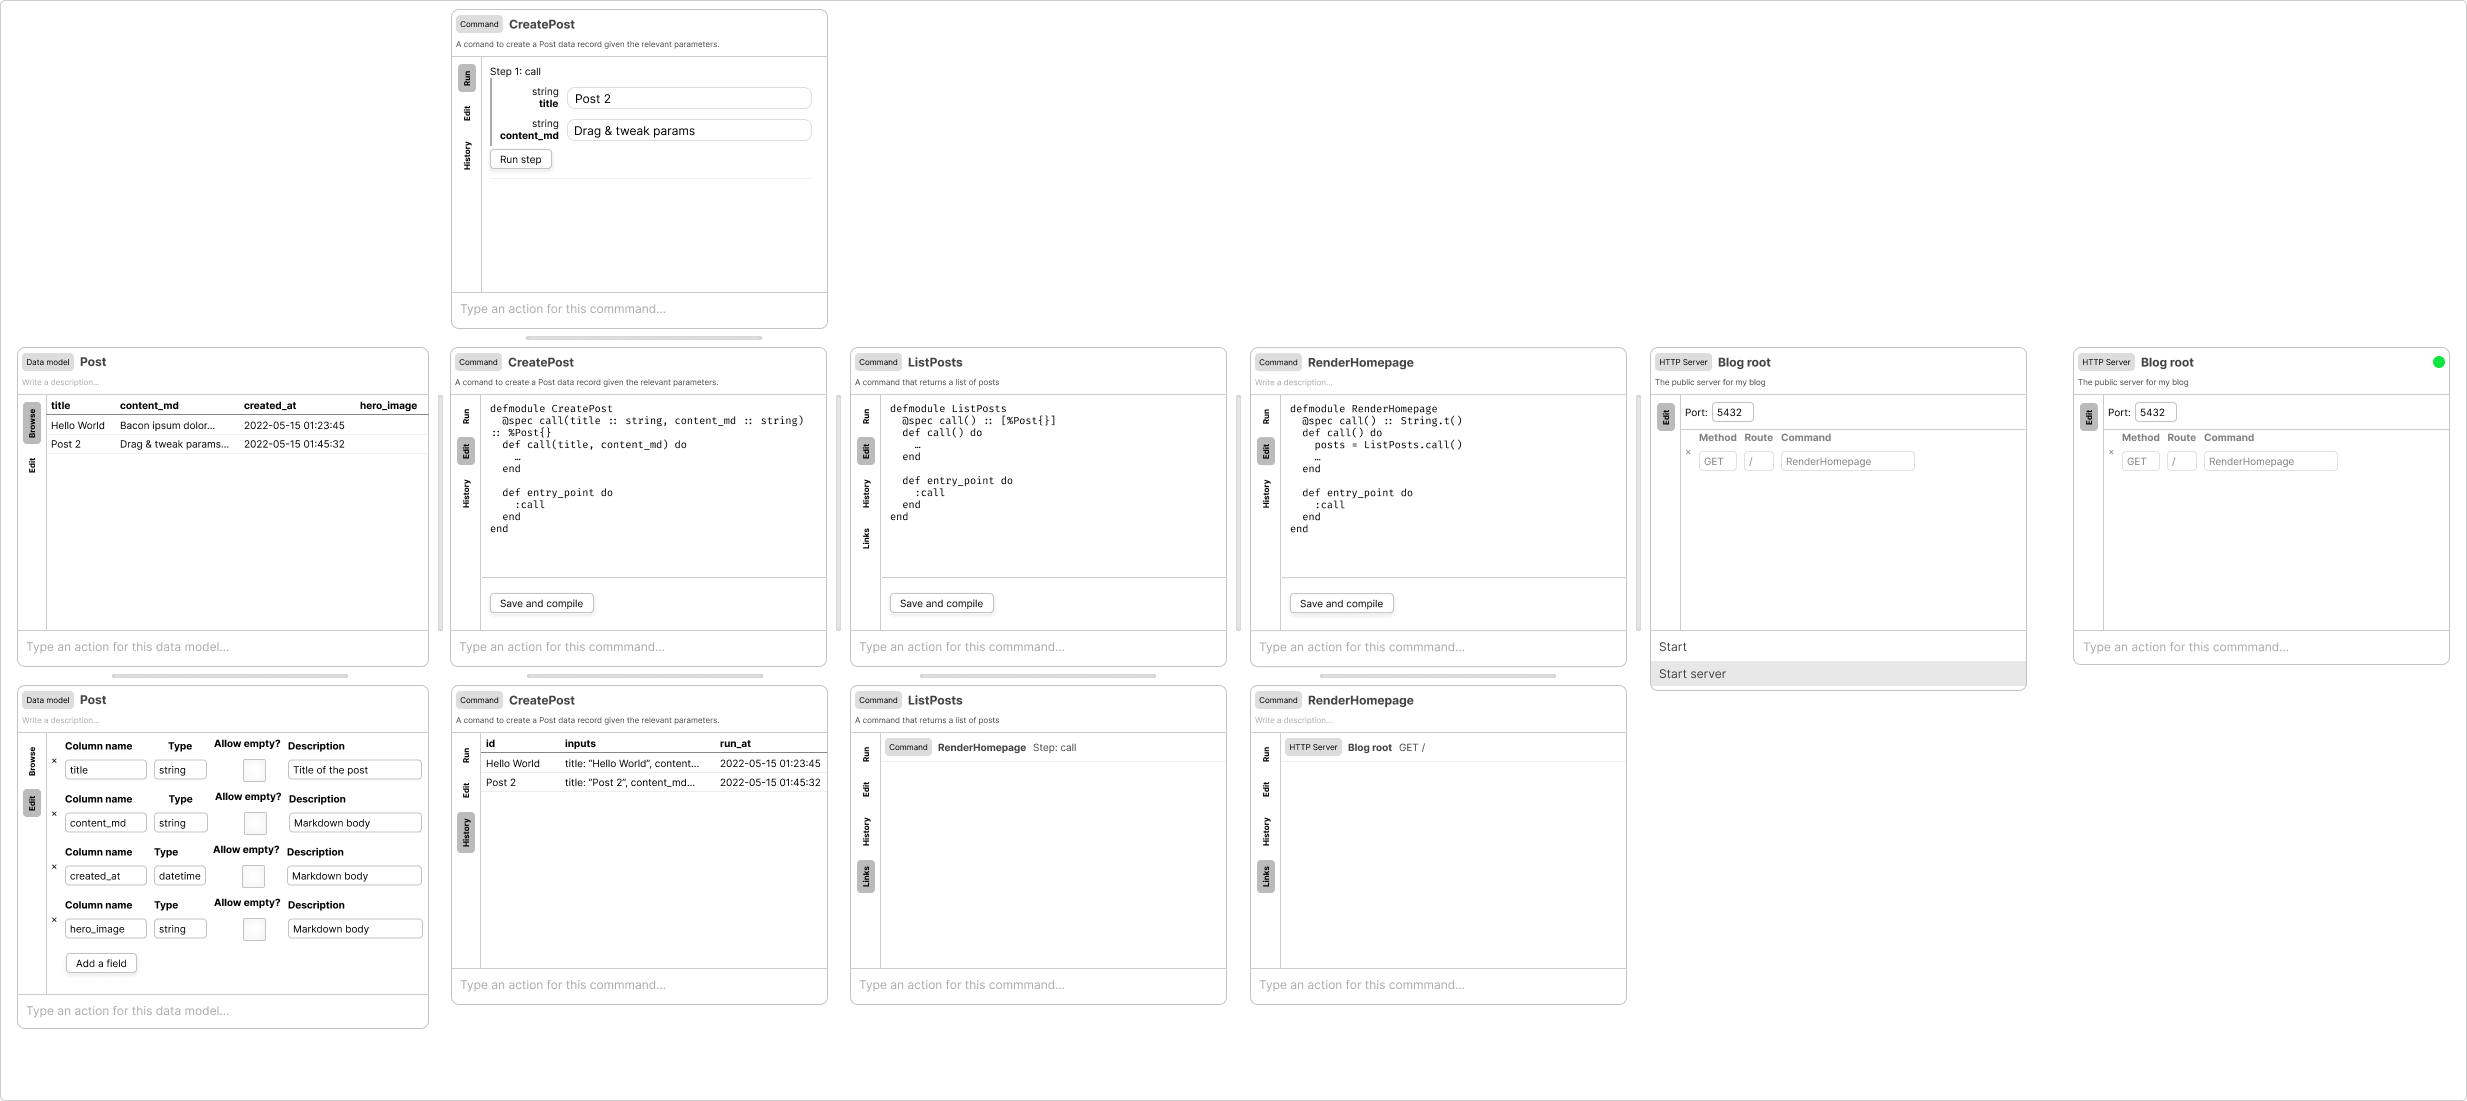
Having defined their RenderHomepage command, the user wants to add this command to an HTTP server they’ve already created. They can use the command bar to find existing data records — in this case, they’re finding an HTTP server based on the server’s name.
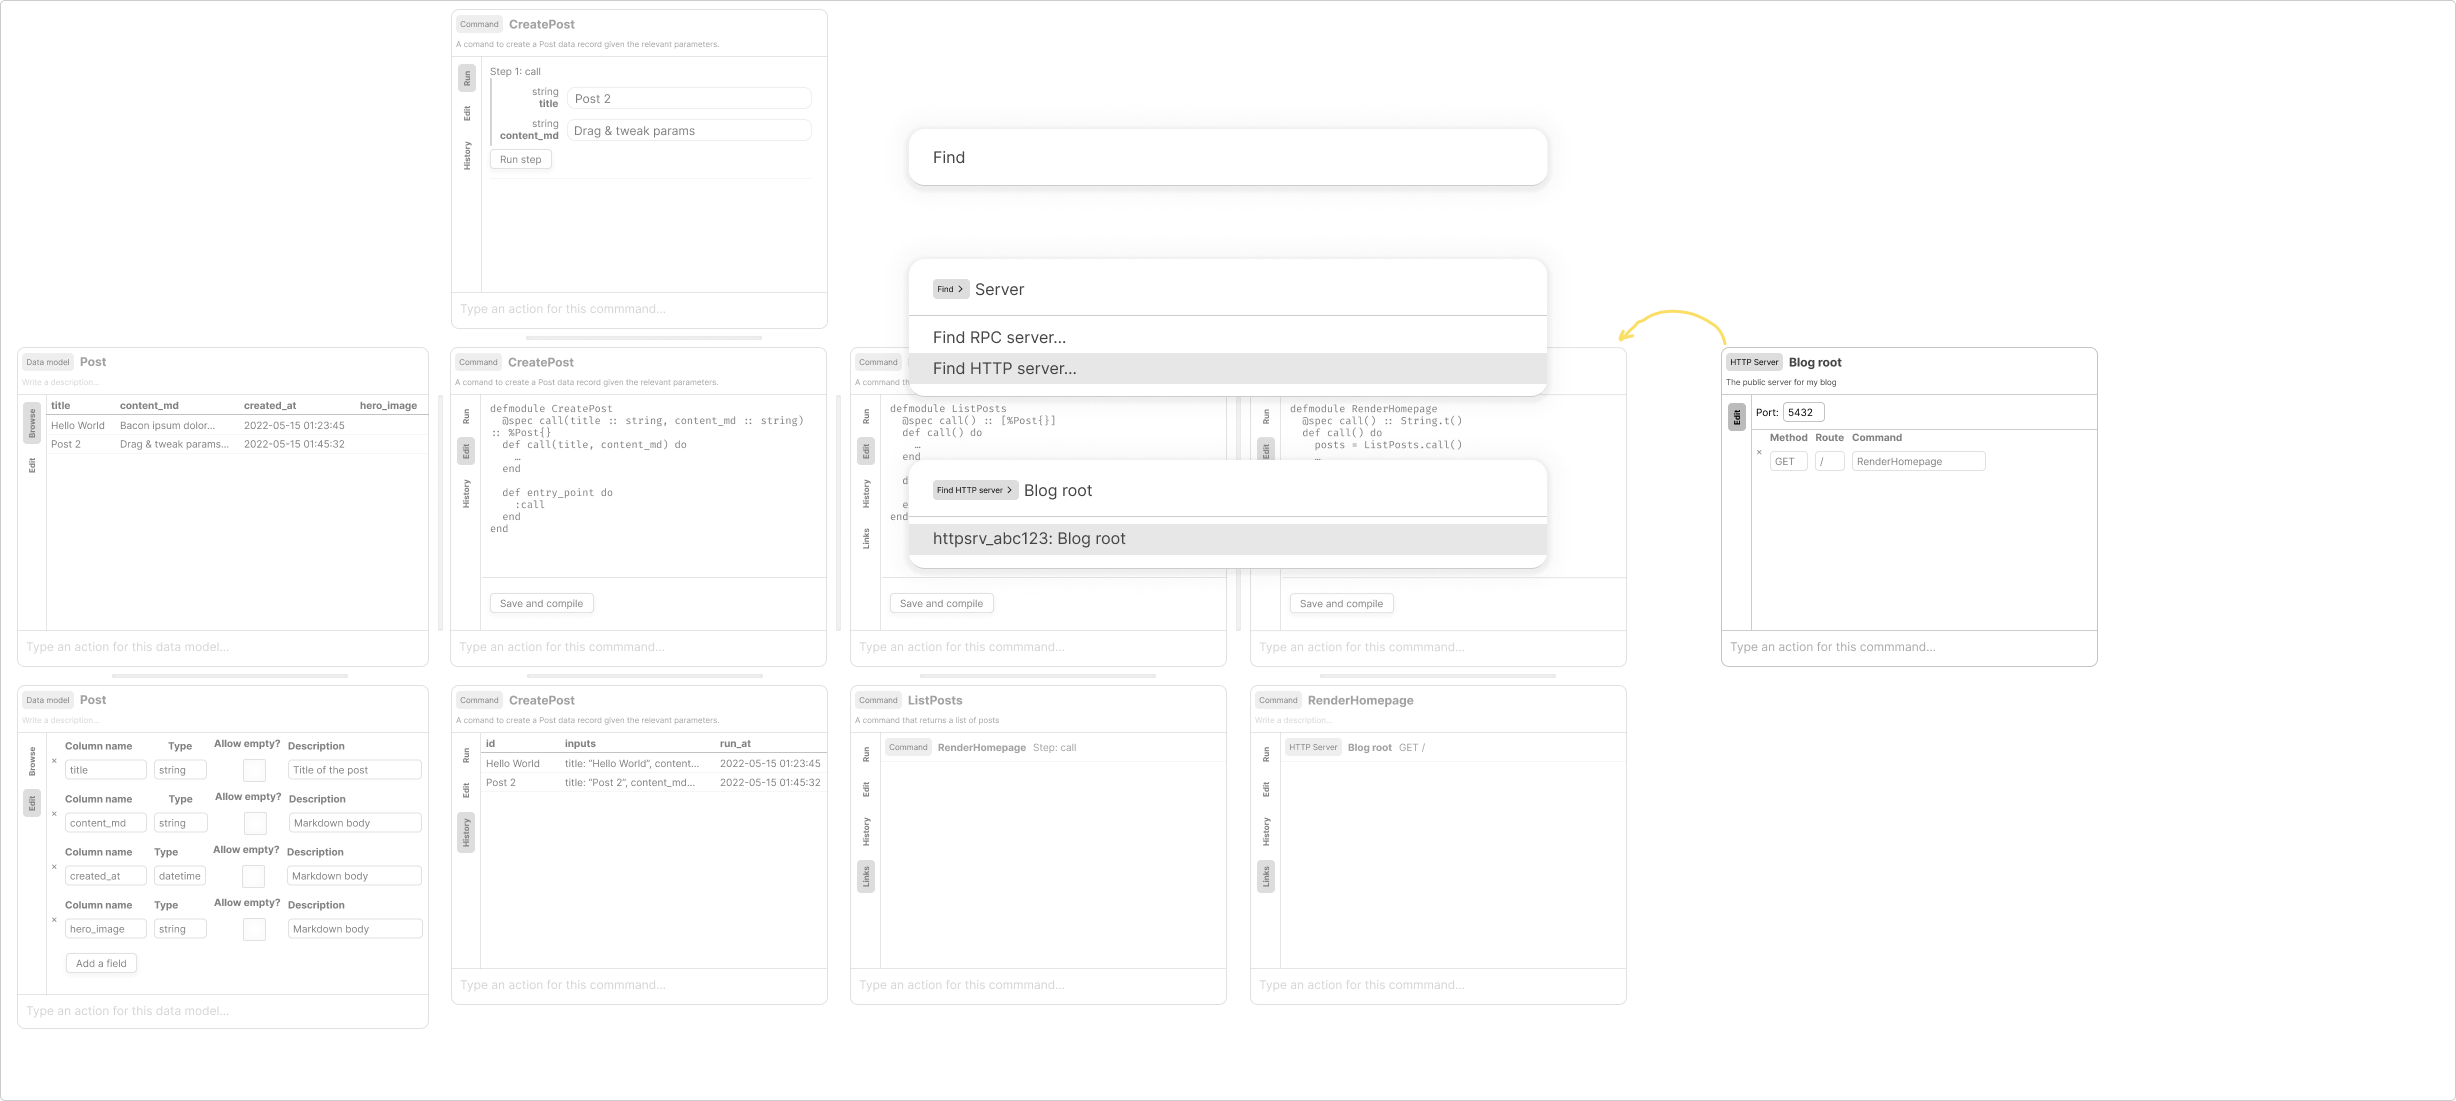
The located server opens in its own pane to the right of the existing sequence (fifth column in the sketch below). The user adds a new endpoint and fills in the Command field by dragging over the proxy icon of the RenderHomepage command. This is an example of the usefulness of proxy icons — as a way to get a reference to something already on-screen.
Finally, the user types “Start” into the server pane’s action bar, and selects the “Start server” action. The server is started, as indicated by the green dot in the right-most pane.
Visual Pipeline Builder
The RenderHomepage command in the examples above calls the ListPost command, and then does something with the results. It’s a standard chunk of code, but it’s a bit hard to quickly see that RenderHomepage depends on ListPost. To make this clearer, I also sketched out a “pipeline” item, where commands can be arranged sequentially, and outputs from commands earlier in the sequence can be used as inputs to commands further down the sequence. The interface is inspired by macOS’s Automator. Pipelines mostly behave like commands from the outside (and I might implement them as a “flavor” of commands), but have different “Run” and “Edit” views.
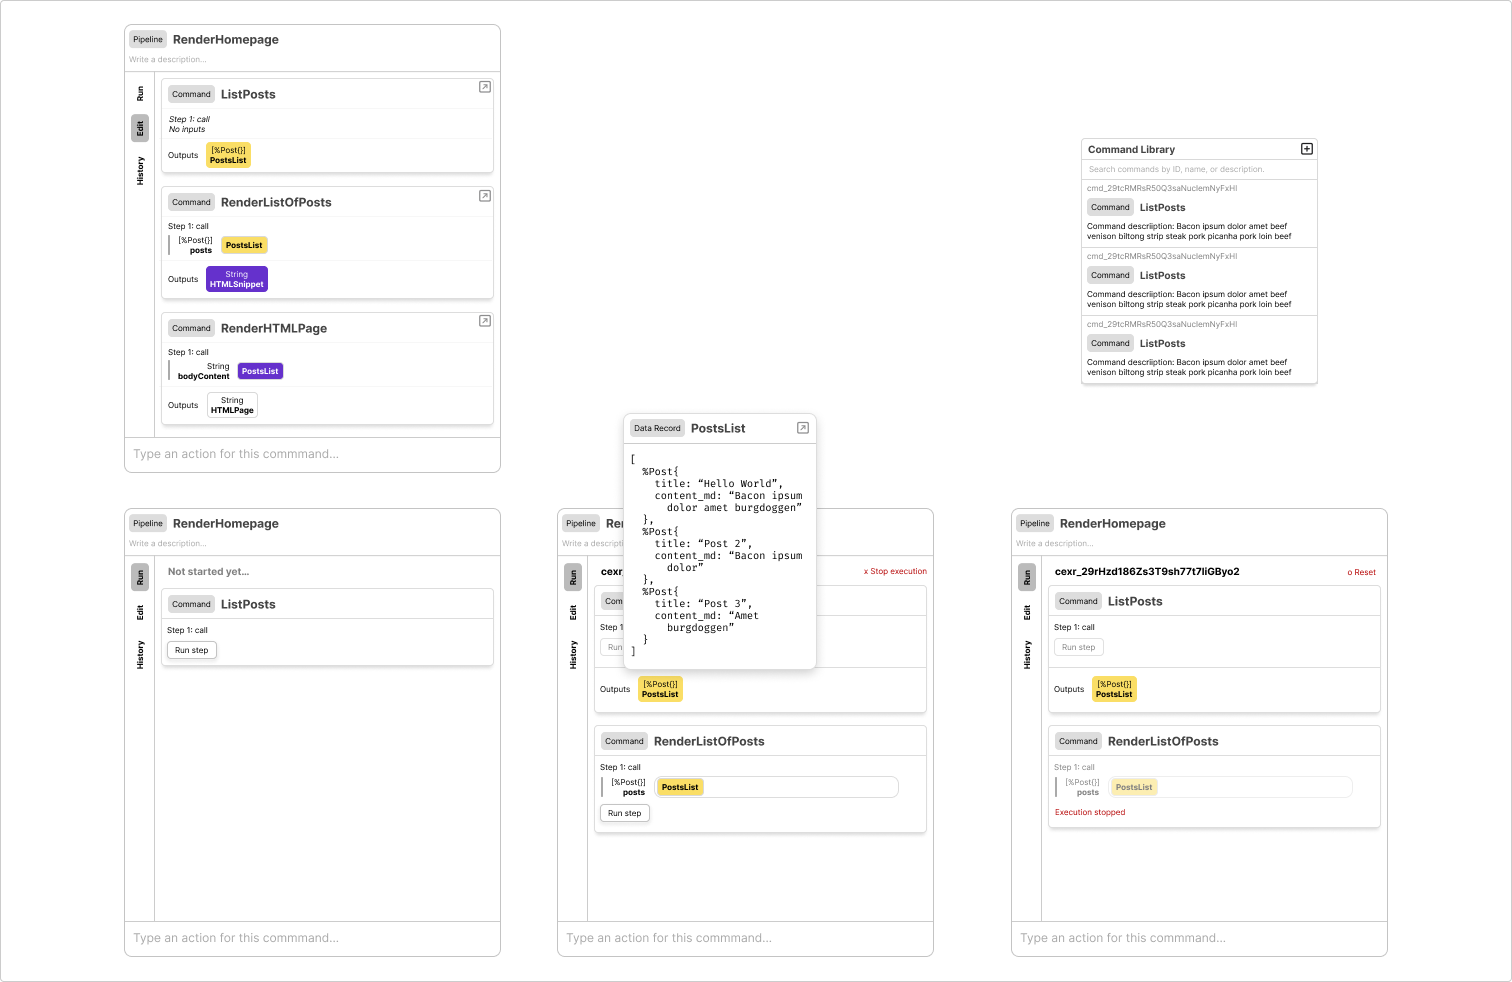
The sketch below shows the “Edit” and “Run” views for a pipeline. The “Edit” view shows a new, compact representation of three commands. These commands can be added from a floating library pane (top-right in the sketch below). This compact command representation focuses on their inputs and outputs, all of which are named and typed[1]. Each named output is represented as a proxy icon that can be dragged into the input field of another command step; when this happens, the output and input take on matching colors.
The “Run” view runs each command (and each step within each command) in sequence. It’ll prompt for inputs at each step, but if the “Edit” view had wired up an input to a previous output, that value will be automatically populated. In the “Run” view, each output view can be previewed in a popover (bottom-middle pane in the sketch below); this output view can be expanded into a proper pane to the right of the current sequence.
In this example, each step is user-initiated, and the user can stop the execution before getting through all the commands in the pipeline. I haven’t thought deeply about entirely-automated pipelines, but they should definitely be possible. They would likely require some pre-conditions though, such as having every non-optional input be wired to a prior command output.
Roadmap: June 2022
There are some additional things I want to explore and sketch:
- I’ve talked about sequences of panes, but I want to figure out what sequences enable. Maybe panes within them should be user-reorderable. Maybe it should actually be a two-dimensional area, rather than a one-dimensional strip. Maybe they should be savable, hideable, and restorable.
- There’s different ways a user might want to query their data in Tanagram: writing a carefully-crafted SQL or GraphQL query, writing a rough query that gets a data sample, or quickly getting a data record by its ID or other property. Each of these query methods should let the user operate as close to their speed-of-thought as possible, and ideally they’d all result in “query result” panes that support visualization transformations (like in this demo).
- I also want to figure out how I can compose a querying interface into a “library” pane, like the one shown in the pipeline sketch above. The ideal user experience allows users to quickly browse or filter a list of commands (or other data types) by typing a few characters, but also, without pomp and circumstance, transforms to supporting complex queries if needed.
- The sketch showing the user finding an existing HTTP server in the command bar raises some interesting questions about the extent of what the command bar can do and how the possibilities are organized.
- I’d like to have a UI “language” consisting of common interaction patterns that can all be keyboard-driven, such that the entire interface is navigable by keyboard. This implies a lot of little details: clearly indicating which area of the UI has keyboard focus, allowing the user to move keyboard focus anywhere else, making sure keyboard shortcuts don’t conflict with each, and avoid making the range of shortcuts overwhelming or kinesthetically difficult.
- The interface chrome for Tanagram: allowing the user to switch between different workspaces for different projects/work areas; showing sync progress with remote kernels; changing the connected kernel.
Currently, Tanagram command steps have named inputs but not named outputs. I think it’s a good idea to have named outputs though, and I’ll change the internals to support that. ↩︎